All Projects
Overview
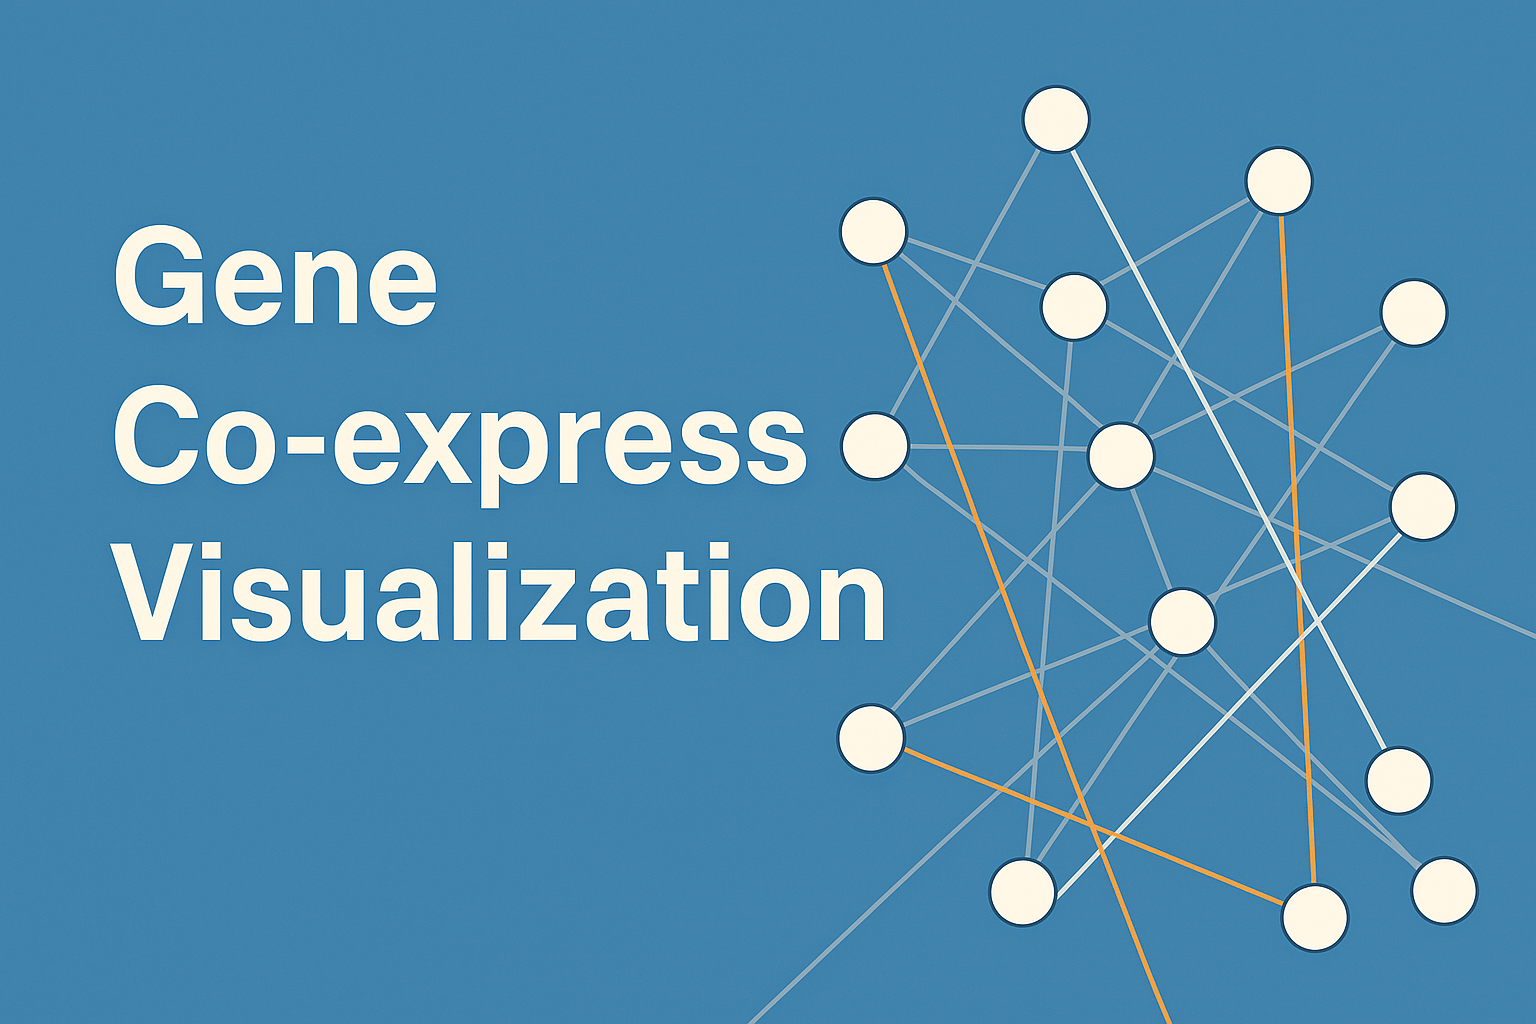
Goal. Identify co-expressed gene groups from a user-provided expression matrix and visualize the network interactively.
Two modes.
- Text mode: write detected clusters to a results file.
- Web mode: serve an interactive D3.js force-layout graph via a Go HTTP server.
Design & Planning
Problem framing
Gene co-expression matrices derived from RNA-seq data are large and hard to explore interactively. Static heatmaps lose cluster structure at scale, and existing tools either required heavy dependencies or didn’t expose the underlying graph structure for interactive exploration.
Key design decisions
- Go for the backend parsing — large expression matrices (thousands of genes) require fast I/O and computation; Go’s performance characteristics make it well-suited for parsing and clustering compared to a scripting language.
- D3.js for interactive cluster exploration in the browser — force-directed layouts let users visually explore co-expression clusters and inspect individual gene connections dynamically.
Architecture overview
[TODO: fill in architecture and challenges]
Challenges & what I’d do differently
[TODO: fill in architecture and challenges]